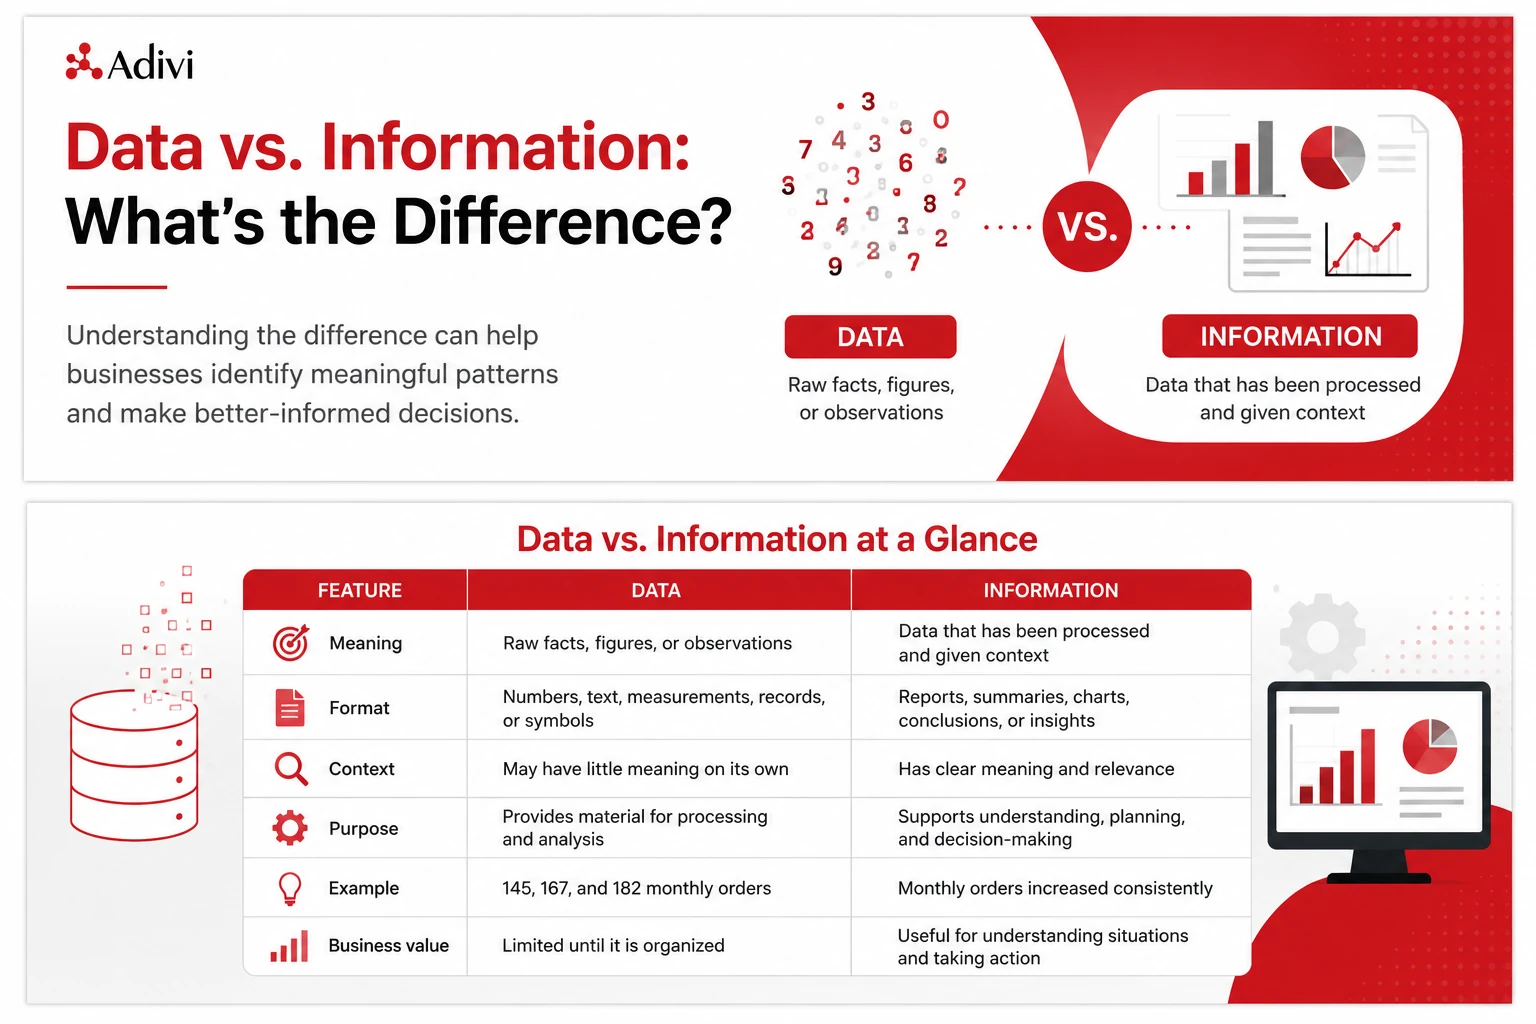
 Data and information are closely connected, but they are not the same. Data consists of raw facts, figures, measurements, or observations. Information is data that has been organized, interpreted, and given context so that it becomes meaningful and useful.
For example, a list of daily sales figures is data. A report explaining that sales increased by 15% during a particular month is information.
Understanding the difference between data and information can help businesses maintain accurate records, identify meaningful patterns, and make better-informed decisions.
Data vs. Information at a Glance
|
Feature |
Data |
Information |
|
Meaning |
Raw facts, figures, or observations |
Data that has been processed and given context |
|
Format |
Numbers, text, measurements, records, or symbols |
Reports, summaries, charts, conclusions, or insights |
|
Context |
May have little meaning on its own |
Has clear meaning and relevance |
|
Purpose |
Provides material for processing and analysis |
Supports understanding, planning, and decision-making |
|
Example |
145, 167, and 182 monthly orders |
Monthly orders increased consistently |
|
Business value |
Limited until it is organized |
Useful for understanding situations and taking action |
What Is Data?
Data is a collection of raw facts, values, or observations that have not yet been fully processed or interpreted.
It may be collected from customer transactions, website activity, employee records, surveys, sensors, business applications, and other sources.
Data may be quantitative, such as sales totals and website visits, or qualitative, such as customer comments and survey responses.
Common examples of data include:
- Customer names
- Email addresses
- Product prices
- Sales figures
- Website visits
- Inventory levels
- Employee hours
- Survey responses
- Dates and timestamps
- Temperature readings
Individual pieces of data may not provide much meaning without additional context.
For example, the number “250” is data. By itself, it does not explain what was measured, when it was recorded, or why it matters.
The value becomes more useful when context is added:
The company received 250 customer enquiries last month.
This statement begins turning the raw value into something people can understand and evaluate.
What Is Information?
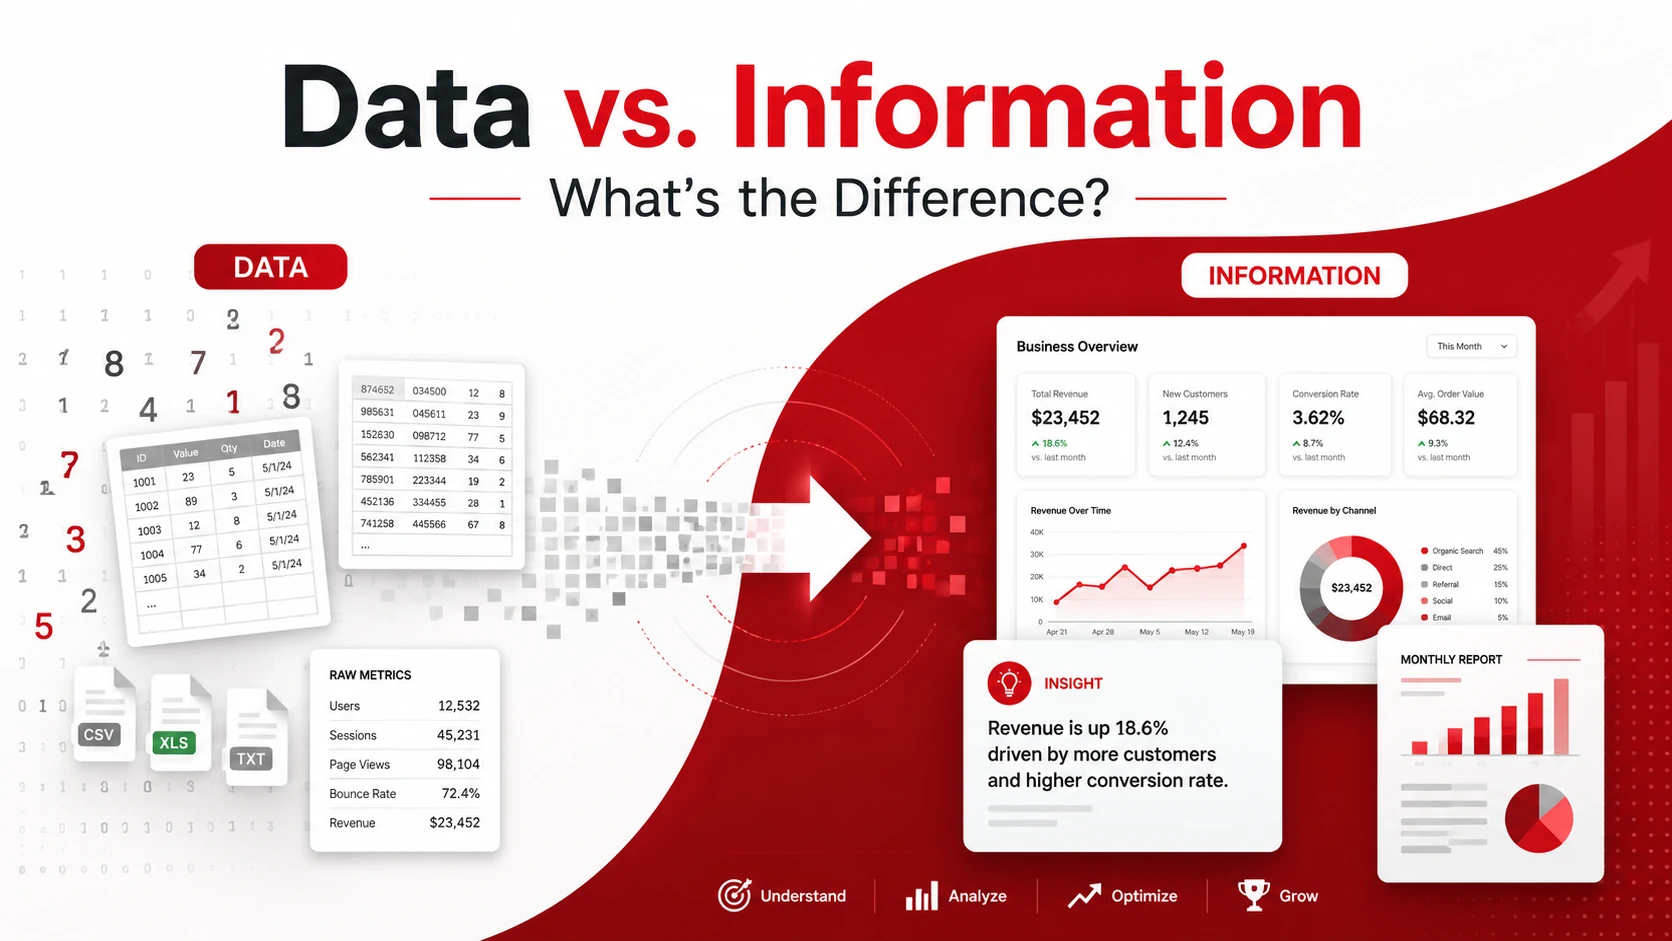
Information is data that has been organized, processed, analyzed, or placed within a meaningful context.
It can help people answer questions such as:
- What happened?
- How does the result compare with previous periods?
- Is there a noticeable pattern?
- What may require further investigation?
- What should decision-makers consider next?
For example, a spreadsheet containing hundreds of individual sales transactions is data. A report showing which products sold the most, how revenue changed, and which location performed best is information.
Information may appear as:
- Reports
- Dashboards
- Charts
- Summaries
- Notifications
- Performance comparisons
- Business forecasts
- Recommendations
The value of information comes from its ability to help people understand a situation and make informed decisions.
How Does Data Become Information?
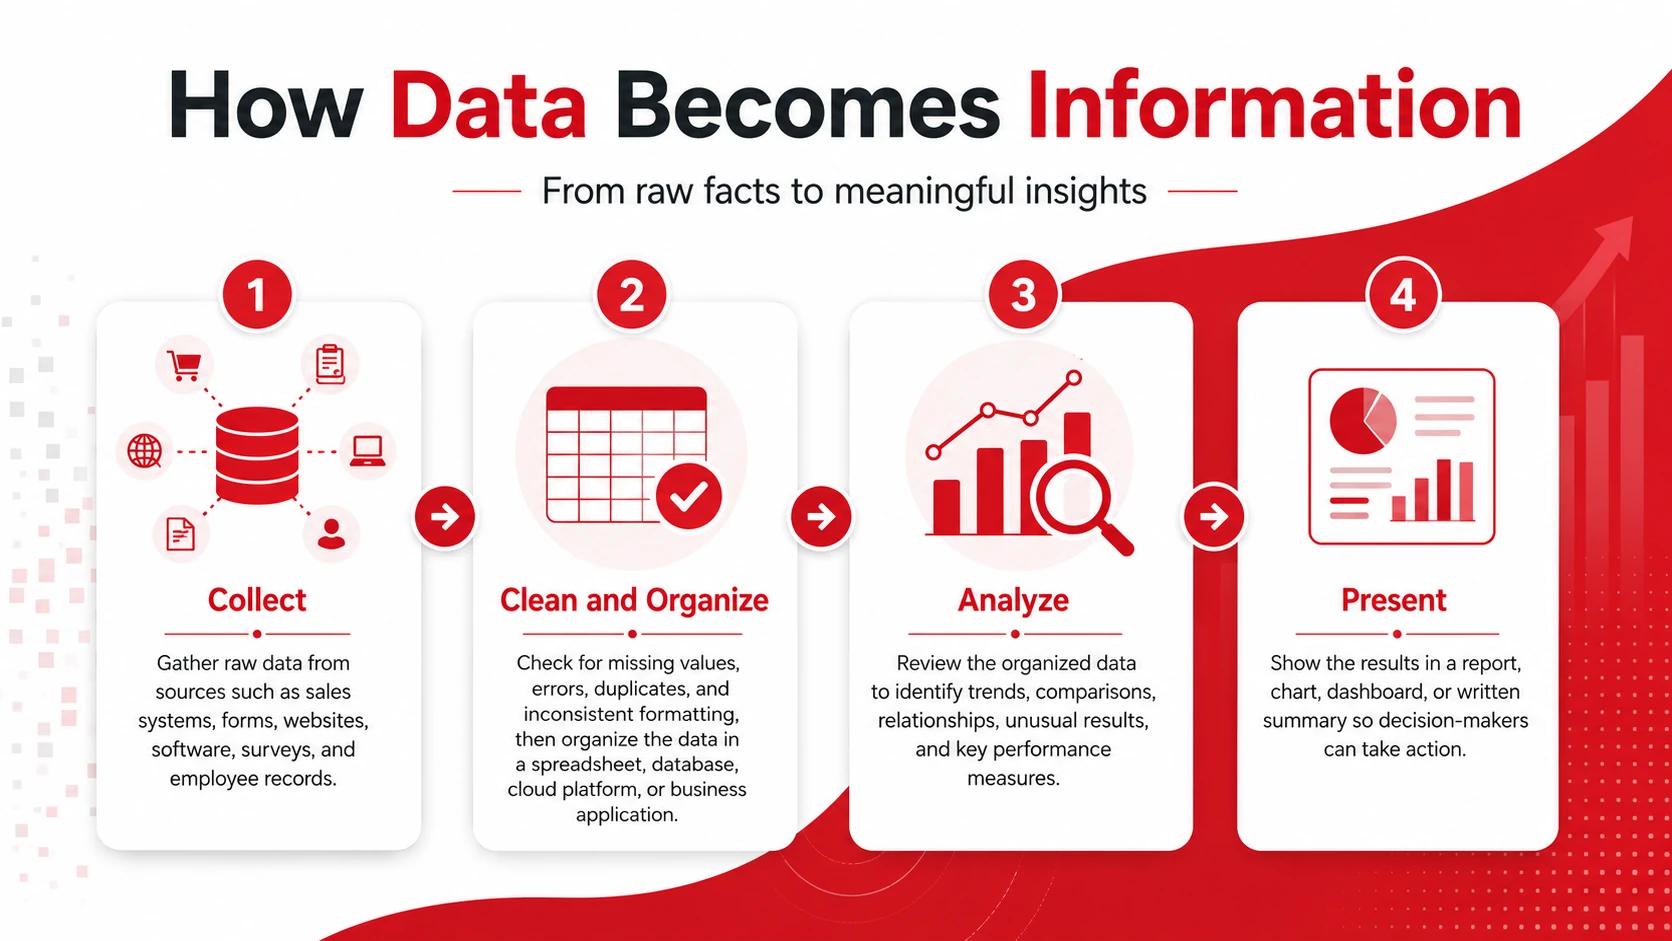
Data becomes information when it is processed and given meaning.
The process generally involves four stages.
1. Data Is Collected
A business gathers raw data from relevant sources.
These sources may include sales systems, customer forms, websites, business software, surveys, equipment, and employee records.
2. Data Is Cleaned and Organized
The collected data is checked for missing values, errors, duplicate records, and inconsistent formatting.
It may then be organized within a spreadsheet, database, cloud platform, or business application.
3. Data Is Analyzed
The organized data is reviewed to identify trends, comparisons, relationships, or unusual results.
Businesses may calculate totals, averages, percentages, growth rates, conversion rates, and other performance measures.
4. Information Is Presented
The results are presented in a useful format, such as a report, chart, dashboard, or written summary.
Decision-makers can then use the information to understand performance, investigate issues, and determine what to do next.
Examples of Data vs. Information
The following examples show how raw data can be transformed into useful information.
Sales Example
Data:
- Monday sales: $4,200
- Tuesday sales: $4,750
- Wednesday sales: $5,100
Information:
Sales increased each day, with Wednesday generating the highest revenue.
Website Example
Data:
- 3,500 website visits
- 140 contact form submissions
- 70 sales
Information:
Four percent of website visitors submitted the contact form, and half of those leads became customers. The website’s overall visitor-to-customer conversion rate was 2%.
Inventory Example
Data:
- 25 units currently in stock
- 20 units sold each week
- 10 days required for delivery
Information:
The current inventory will last approximately nine days. The product should be reordered now to reduce the risk of running out before the next delivery arrives.
Customer Service Example
Data:
- 175 support tickets received
- 120 resolved within one day
- 55 took longer than one day
Information:
Most support tickets were resolved within one day, but approximately 31% required a longer response time.
Task Completion Example
Data:
- Employee A completed 42 tasks
- Employee B completed 37 tasks
- Employee C completed 51 tasks
Information:
Employee C completed the highest number of tasks during the measured period.
Other factors, such as task difficulty, quality, and accuracy, would need to be considered before drawing conclusions about overall employee performance.
Why Is the Difference Important for Businesses?
Businesses collect large amounts of data through their daily activities. However, collecting data alone does not automatically create value.
The data must be organized and interpreted before it can support meaningful action.
Understanding the difference between data and information can help businesses:
- Measure performance
- Identify customer behaviour
- Track expenses and revenue
- Manage inventory
- Monitor employee productivity
- Detect operational problems
- Improve customer service
- Plan future investments
- Make evidence-based decisions
For example, knowing that a company received 500 enquiries is useful data. Learning that most of those enquiries came from one marketing campaign provides information that may guide future spending.
Without reliable information, business decisions may rely too heavily on assumptions.
Why Data Quality Matters
Useful information depends on accurate and reliable data.
If the original data is incomplete, outdated, duplicated, or incorrect, the resulting information may also be misleading.
Common data-quality issues include:
- Missing records
- Typing errors
- Duplicate entries
- Inconsistent formats
- Outdated customer details
- Incorrect measurements
- Unclear data sources
- Unauthorized changes
For example, a sales report may show inaccurate results if transactions are entered twice or if some purchases are missing.
Businesses should regularly review how their data is collected, stored, updated, protected, and backed up. Clear processes and reliable technology can help maintain data accuracy and availability.
How Technology Turns Data Into Information
Business technology makes it easier to collect, organize, analyze, and present data.
Common tools include:
- Customer relationship management systems
- Accounting software
- Business intelligence platforms
- Inventory management systems
- Cloud storage
- Reporting dashboards
- Data backup solutions
- Spreadsheet applications
These systems can reduce manual work and give employees faster access to useful information.
However, technology must be properly configured and maintained. Poor integrations, inconsistent records, weak security, and unreliable backups can affect the quality and availability of business information.
Adivi helps businesses protect, back up, and securely access their data through managed IT services, cybersecurity, cloud solutions, and reliable business systems.
Contact Adivi to discuss your IT support and data protection requirements.
Frequently Asked Questions
What is the main difference between data and information?
Data consists of raw facts, values, or observations. Information is data that has been processed, organized, and given context so that it becomes meaningful and useful.
What is an example of data and information?
A list of individual sales transactions is data. A monthly report showing total revenue, sales growth, and the best-selling products is information.
Can data be useful without being processed?
Data can still have value, but its usefulness may be limited without context. Processing and organizing data makes it easier to understand, compare, and apply.
How does data become information?
Data becomes information when it is cleaned, organized, analyzed, and presented in a meaningful format, such as a report, chart, dashboard, or summary.
Why is accurate data important?
Accurate data helps produce reliable information. Incorrect, incomplete, or outdated data can lead to misleading reports and poor business decisions.
Is information more valuable than data?
Information is generally more useful for decision-making because it provides meaning and context. However, reliable information cannot be created without accurate data.